Nissan · EU monitoring data
Nissan X-trail: CO2 & EU registrations
113,449 new registrations on record, fleet-average CO2 from 0 g/km (WLTP, 2025). Official data reported by EU member states.
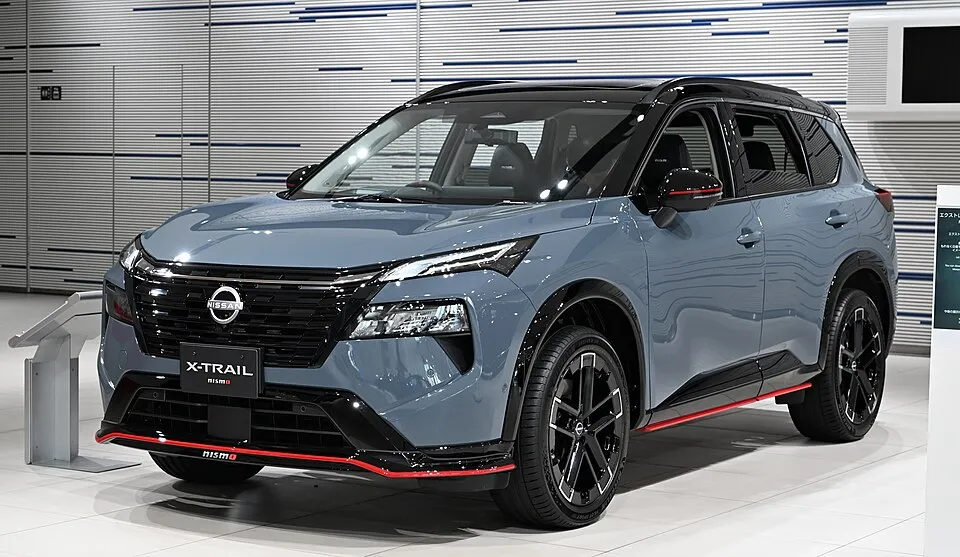
The Nissan X-Trail is a compact crossover SUV produced by the Japanese automaker Nissan since 2000, replacing the Rasheen and Terrano II. Since 2018, it is positioned between the Qashqai and the larger Murano.
By year and fuel type
Fleet averages across all Nissan X-trail registrations of that year and fuel. CO2 is WLTP where available (NEDC shown for older years). Consumption is l/100km for combustion, Wh/km for electric.
| Year | Fuel | Registrations | CO2 WLTP | CO2 NEDC | Consumption | Mass kg | Power kW |
|---|---|---|---|---|---|---|---|
| 2025 | Electric | 125 | 0 g/km | - | 15 Wh/km | 1,875 | - |
| 2025 | Petrol | 1,030 | 106.1 g/km | - | 6.1 l/100km | 1,815 | 118 |
| 2024 | Petrol | 11 | 148.9 g/km | - | 6.5 l/100km | 1,849 | 117 |
| 2023 | Petrol | 1,841 | 149.8 g/km | - | 6.6 l/100km | 1,851 | 117 |
| 2022 | Petrol | 163 | 153.8 g/km | - | 6.8 l/100km | 1,848 | 116 |
| 2021 | Diesel | 716 | 185.3 g/km | - | 6.9 l/100km | 1,739 | 110 |
| 2021 | Petrol | 1,987 | 164.3 g/km | - | 6.8 l/100km | 1,554 | 116 |
| 2020 | Diesel | 2,663 | 181.7 g/km | 148.8 g/km | - | 1,735 | 110 |
| 2020 | Petrol | 2,471 | 177.1 g/km | 147.1 g/km | - | 1,574 | 117 |
| 2019 | Diesel | 6,567 | 182.5 g/km | 145.6 g/km | - | 1,725 | 109 |
| 2019 | Petrol | 1,685 | 188.2 g/km | 147.9 g/km | - | 1,589 | 118 |
| 2018 | Diesel | 14,762 | - | 144.7 g/km | - | 1,690 | 107 |
| 2018 | Petrol | 4,816 | - | 149.4 g/km | - | 1,576 | 120 |
| 2017 | Diesel | 20,187 | - | 140.3 g/km | - | 1,688 | 108 |
| 2017 | Petrol | 2,264 | - | 148.9 g/km | - | 1,589 | 145 |
| 2016 | Diesel | 19,715 | - | - | - | 1,685 | 96 |
| 2016 | Petrol | 1,733 | - | - | - | 1,611 | 120 |
| 2015 | Diesel | 14,576 | - | - | - | 1,671 | 96 |
| 2015 | Petrol | 469 | - | - | - | 1,627 | 120 |
| 2014 | Diesel | 5,694 | - | - | - | 1,661 | 99 |
| 2013 | 275 | - | - | - | 1,733 | - | |
| 2013 | Diesel | 1,447 | - | - | - | 1,758 | 111 |
| 2012 | Diesel | 2,968 | - | - | - | 1,739 | 111 |
| 2011 | Diesel | 2,800 | - | - | - | 1,737 | 111 |
| 2011 | Petrol | 10 | - | - | - | 1,576 | 104 |
| 2010 | 17 | - | - | - | 1,714 | - | |
| 2010 | Diesel | 2,382 | - | - | - | 1,748 | - |
| 2010 | Petrol | 75 | - | - | - | 1,585 | - |
Source: European Environment Agency, CO2 emissions from new passenger cars (Regulation (EU) 2019/631 monitoring), CC-BY 4.0, attribution EEA / DG CLIMA. Figures are fleet averages of new registrations, not per-vehicle values. Details on About & Data Sources.