BMW · EU monitoring data
BMW X5 Xdrive25d: CO2 & EU registrations
25,703 new registrations on record, fleet-average CO2 from 204.5 g/km (WLTP, 2023). Official data reported by EU member states.
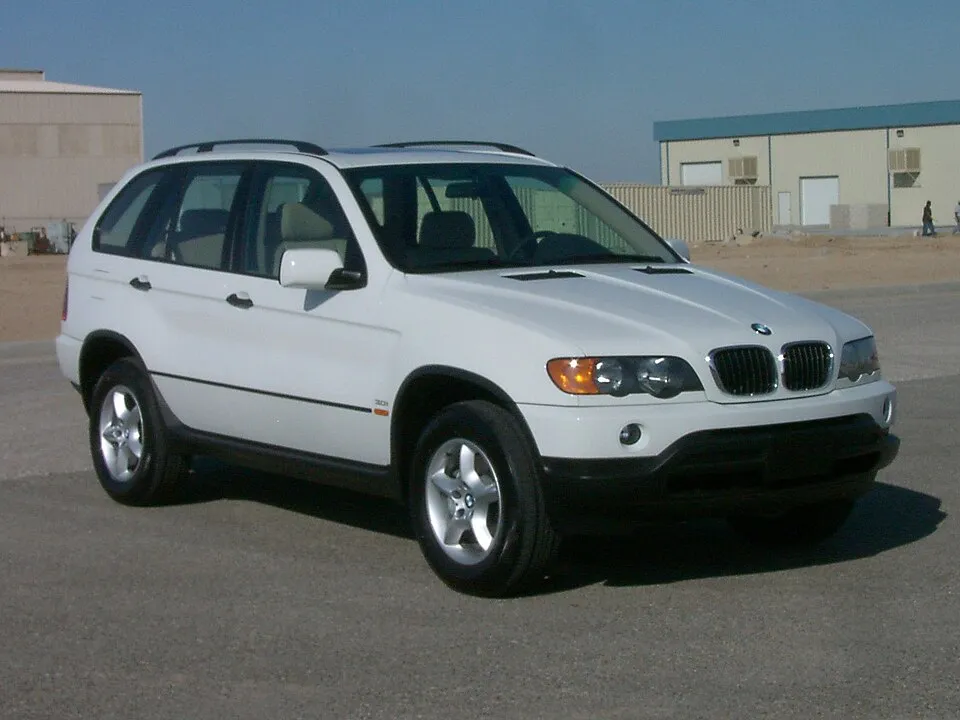
The BMW E53 is the first generation BMW X5 mid-size luxury crossover SUV. The vehicle was the first SUV ever produced by BMW. It was produced between 1999 and 2006 and was replaced by the E70 X5.
By year and fuel type
Fleet averages across all BMW X5 Xdrive25d registrations of that year and fuel. CO2 is WLTP where available (NEDC shown for older years). Consumption is l/100km for combustion, Wh/km for electric.
| Year | Fuel | Registrations | CO2 WLTP | CO2 NEDC | Consumption | Mass kg | Power kW |
|---|---|---|---|---|---|---|---|
| 2023 | Diesel | 757 | 204.5 g/km | - | 6.5 l/100km | 2,147 | 169 |
| 2022 | Diesel | 1,999 | 192.9 g/km | - | 6.3 l/100km | 2,147 | 170 |
| 2021 | Diesel | 2,064 | 195 g/km | - | 7.4 l/100km | 2,149 | 169 |
| 2020 | Diesel | 2,365 | 195.5 g/km | 151 g/km | - | 2,149 | 169 |
| 2019 | Diesel | 878 | 197.8 g/km | 151.3 g/km | - | 2,145 | 169 |
| 2018 | Diesel | 2,138 | - | 146.3 g/km | - | 2,074 | 169 |
| 2017 | Diesel | 1,942 | - | 147 g/km | - | 2,115 | 196 |
| 2016 | Diesel | 4,332 | - | - | - | 2,115 | 169 |
| 2015 | Diesel | 4,818 | - | - | - | 2,115 | 163 |
| 2014 | Diesel | 4,410 | - | - | - | 2,115 | 160 |
Frequently Asked Questions
What are the CO2 emissions of a BMW X5 Xdrive25d?
Official EU monitoring data for 2023 registrations shows fleet-average CO2 from 204.5 g/km (WLTP) for the BMW X5 Xdrive25d, varying by fuel type and configuration; the table on this page lists every year and fuel type.
How many BMW X5 Xdrive25d are registered in the EU?
The EEA monitoring database records 25,703 new BMW X5 Xdrive25d registrations in Europe between 2010 and 2025. These are new-car registrations reported by member states, not the number currently on the road.
Source: European Environment Agency, CO2 emissions from new passenger cars (Regulation (EU) 2019/631 monitoring), CC-BY 4.0, attribution EEA / DG CLIMA. Figures are fleet averages of new registrations, not per-vehicle values. Details on About & Data Sources.