Audi · EU monitoring data
Audi RS 5 Sportback: CO2 & EU registrations
933 new registrations on record, fleet-average CO2 from 221.6 g/km (WLTP, 2025). Official data reported by EU member states.
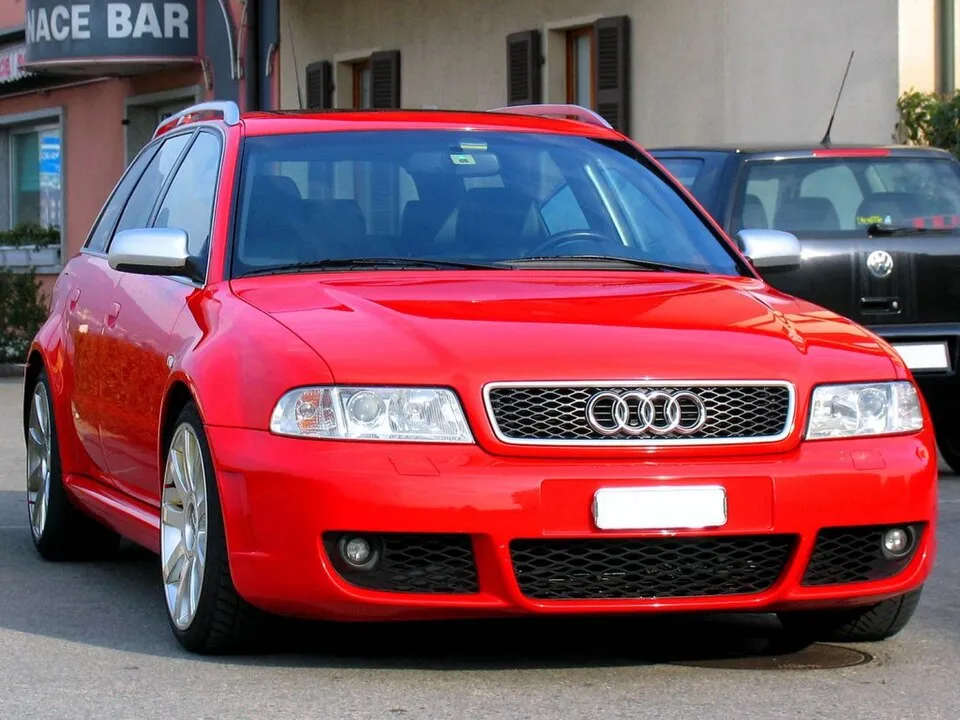
The Audi RS 4 is the high-performance variant of the Audi A4 range produced by Audi Sport GmbH for AUDI AG, a division of the Volkswagen Group. It sits above the Audi S4 as the fastest, most sports-focused car based on the A4's "B" automobile platform. The RS 4 was reintroduced in 2012, based on the A4 Avant instead of the sedan as did the original model.
By year and fuel type
Fleet averages across all Audi RS 5 Sportback registrations of that year and fuel. CO2 is WLTP where available (NEDC shown for older years). Consumption is l/100km for combustion, Wh/km for electric.
| Year | Fuel | Registrations | CO2 WLTP | CO2 NEDC | Consumption | Mass kg | Power kW |
|---|---|---|---|---|---|---|---|
| 2025 | Petrol | 54 | 221.6 g/km | - | 9.8 l/100km | 1,813 | 343 |
| 2024 | Petrol | 142 | 218.8 g/km | - | 9.7 l/100km | 1,824 | 333 |
| 2023 | Petrol | 166 | 222.9 g/km | - | 9.7 l/100km | 1,816 | 329 |
| 2022 | Petrol | 112 | 222.5 g/km | - | 9.1 l/100km | 1,816 | 331 |
| 2021 | Petrol | 154 | 222.4 g/km | - | 9 l/100km | 1,805 | 331 |
| 2020 | Petrol | 124 | 219.6 g/km | 208.5 g/km | - | 1,795 | 331 |
| 2019 | Petrol | 181 | 216.3 g/km | 207 g/km | - | 1,795 | 331 |
Frequently Asked Questions
What are the CO2 emissions of a Audi RS 5 Sportback?
Official EU monitoring data for 2025 registrations shows fleet-average CO2 from 221.6 g/km (WLTP) for the Audi RS 5 Sportback, varying by fuel type and configuration; the table on this page lists every year and fuel type.
How many Audi RS 5 Sportback are registered in the EU?
The EEA monitoring database records 933 new Audi RS 5 Sportback registrations in Europe between 2010 and 2025. These are new-car registrations reported by member states, not the number currently on the road.
Source: European Environment Agency, CO2 emissions from new passenger cars (Regulation (EU) 2019/631 monitoring), CC-BY 4.0, attribution EEA / DG CLIMA. Figures are fleet averages of new registrations, not per-vehicle values. Details on About & Data Sources.